Our latest quarterly Mobile Trade-In and Upgrade Industry Trends Reports is now available and provides valuable insights into the secondary device market.
Here are three highlights from our Q2 report:
- Consumers are holding onto their devices for longer than ever
- Average trade-in value for mobiles reaches $141
- iPhone 11 has been the top turned in device for nine straight quarters
Let’s dive into the results.
iPhone users holding onto their devices for longer
We saw mixed results for the average age of devices at trade-in or upgrade. Overall, it was 3.71 years, up from 3.64 years the previous quarter. The increase was primarily due to iPhones which went from 3.63 years in 1Q24 to 3.78 years in 2Q24. However, the average age of Android smartphones decreased from the first quarter this year going from 3.67 years to 3.5 years.
Trade-in values on the rise
Trade-in values for both iPhones and Android smartphones increased from 1Q24. The average trade-in value for Android smartphones was $103.45, up 37% from the previous quarter. Though the average age of iPhones went up in the second quarter, their trade-in value did not decrease as may be expected. The average trade-in value for Apple iPhones increased 21% quarter-over-quarter going from $163.47 to $198.01. The combined average trade-in value for Q2 was $141.02.
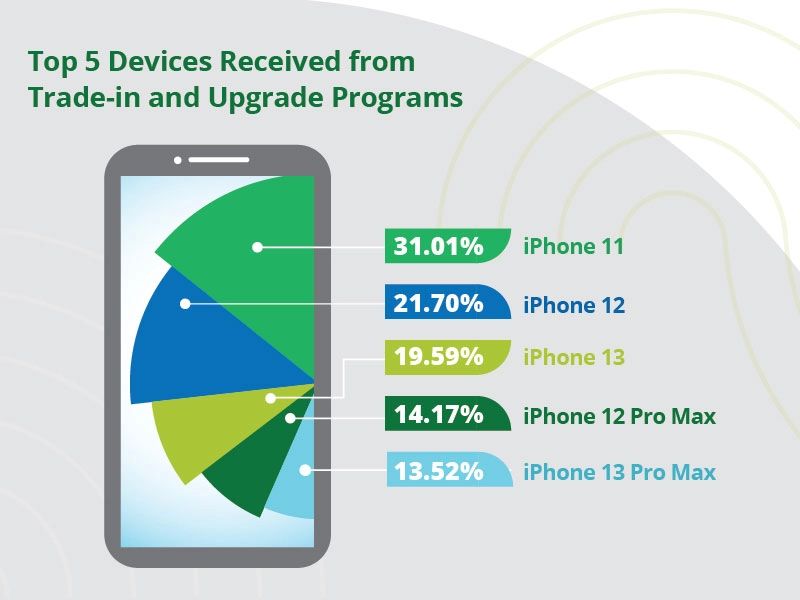
Top 5 devices received from trade-in and upgrade programs
The iPhone 11 still stands as the undisputed leader as the most turned in device, whether from trade-in or upgrade programs, for the ninth consecutive quarter. It holds a 31.01% share of the top five turned in devices and is the only 4G device in this list.
A win for everyone
Overall, consumers are keeping their devices for longer periods, yet they actively engage in trade-in and upgrade initiatives. These programs aim to enhance affordability by reducing device costs, offering monthly bill credits, and freeing up funds for accessories or other services. Simultaneously, these initiatives generate new revenue for operators, OEMs, MSOs, and retailers, while also showcasing their commitment to environmental sustainability.
See more in our Q2 infographic.